

Other Diagnostics
Diagnosing the kernel the other way!
There are various diagnostic tools that the kernel can make use of, including those listed below.
Stack Frames
This is internally used by the kernel debugger and the kernel exception to allow getting information about the source code that generated the call. Currently, this information is provided:
Method name: The routine name that made a call to the class constructor
Line number: The line number of the method described above
Column number: The column number found within the line
File name: The file name of the class that the method situates
When the constructor is called, it generates information about the third stack frame to get the caller's method info. If the frame number is specified, it gets offset by +1 to get info about the needed method.
This method is internally called by the debug writer. If you really want to create an instance of this class, you'll have to use Reflection. The class name is DebugStackFrame in the Nitrocid.Kernel.Debugging.Trace namespace.
Kernel dump files
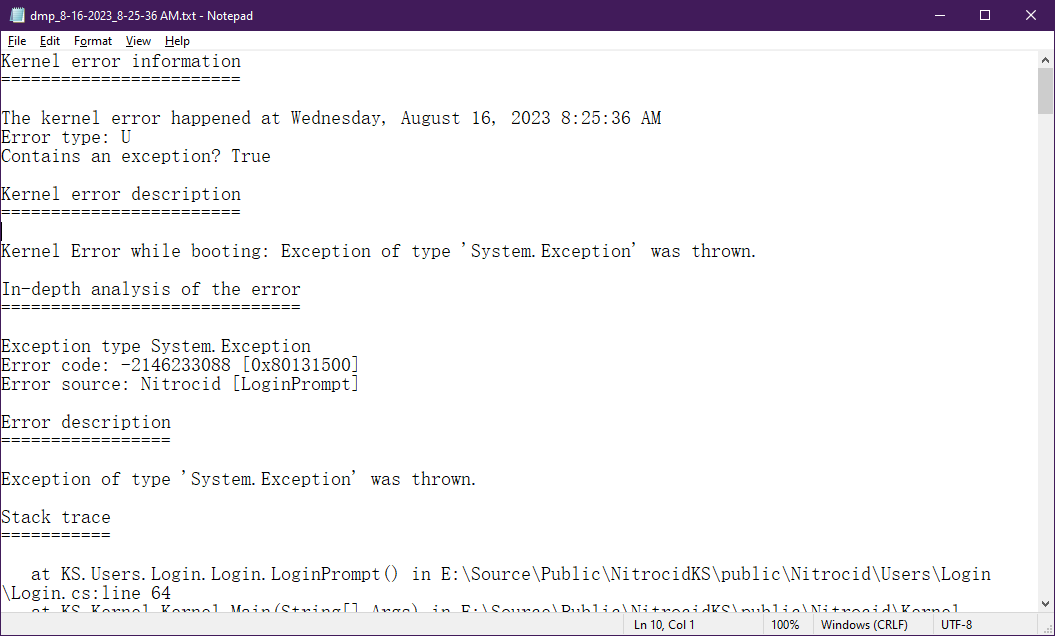
In the event that the kernel reported a kernel panic in all of the types, whether continuable or uncontinuable, the kernel dump file will be generated under the name of dmp_date_time.txt in the kernel configuration directory. These files assist us in debugging the severe kernel crashes in case the bug involves this event.
This file includes the following information:
Kernel error code
Error description
In-depth analysis of the error
Stack trace
Nitrocid kernel threads
OS threads spawned by Nitrocid
Threads' backtraces
Version information
The kernel error codes are listed below from the least severe to the most severe:
C: Indicates that the kernel error is minor, but still seriousS: Serious kernel errorF: Fatal kernel errorU: Unrecoverable kernel error
The first-chance kernel errors of the above types are the first failures. During the error handling, if it encountered a second failure, it escalates the severity of the error to the double panic. Finally, if the double panic handler experiences a third fault, the host operating system will force the kernel to exit.
In case of the third failure events, you can find the event in the Application Events within the Event Viewer if running on Windows or the error directly dumped to the application on Linux.
Kernel Exceptions
The kernel exceptions are just normal errors with a generic message intended to display extended information about the error the kernel is experiencing. The kernel exception types and their messages are typically found in this file:

To make a kernel exception, throw a new instance of KernelException found in the Nitrocid.Kernel.Exceptions namespace in one of the forms:
Typically, the message displays the exception type, the message, and the exception information. As always, if you believe that it's a bug, make an issue in our GitHub repository.
Debug shell
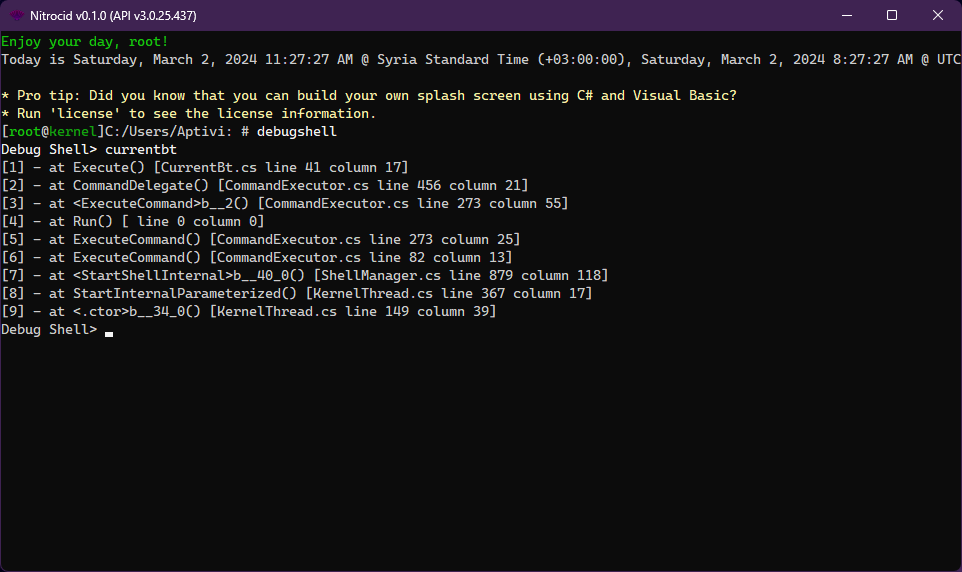
The debug shell allows you to diagnose the kernel in depth. The following commands are available in the below page:
Commands ListIf you're running on Windows 7, threadsbt is not going to work due to how it uses the PssCaptureSnapshot Windows API function, which is first introduced on Windows 8.1, which makes this operating system a minimum requirement for using this command.
Additionally, the same command will not work on Android devices and will fail with this error: